Damped oscillations - Solution
To find the position of a peak we use the fact that the cosine function is a maximum when its argument is 0. So we solve:10*pi*t+pi/4 = 0
Rearranging gives t=-1/40.
As this is a negative value we add on the value of the period to find the first peak in the positive time zone. The period is given by 2*pi / 10*pi =0.2, so the first peak will occur at:
t=-1/40+0.2 = 0.175
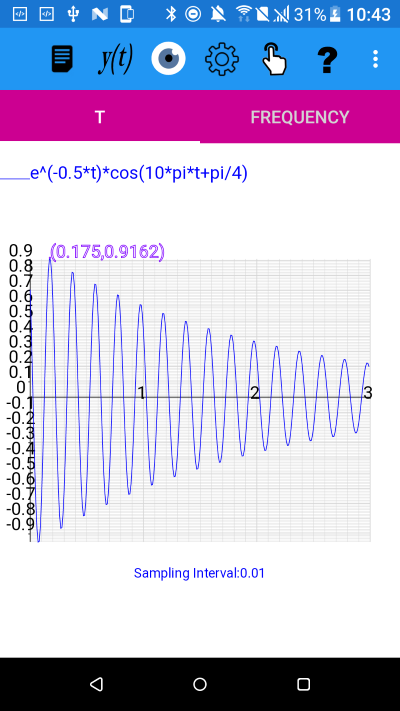
We use the General Function to plot (e^(-0.5*t))*cos(10*pi*t+pi/4)
And the Display Position to enter t=0.166667 and get the following result for the first peak
Values for e^(-0.5*t)*cos(10*pi*t+pi/4):
Function: (0.175, 0.916219)
Function: (0.175, 0.916219)
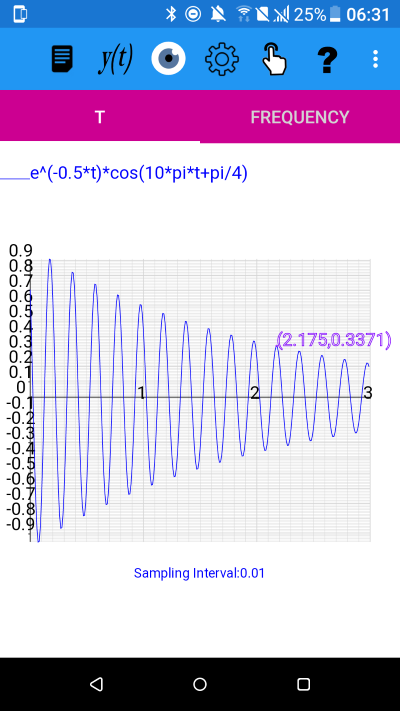
We use Display Position again to enter 2.166667 and find
Values for e^(-0.5*t)*cos(10*pi*t+pi/4):
Function: (2.175, 0.337058)
Values for e^(-0.5*t)*cos(10*pi*t+pi/4):
Function: (2.175, 0.337058)
Proportional Decrease
The proportional decrease found, after 2 seconds, is 0.337058 / 0.916219 =0.36788 to 6 s.f.Considering any two second interval
To confirm this result for any 2 second interval, we consider the exponential part of the function, e^(-0.5*t), and two values t0 and t0+2.- At time t0 we have e^(-0.5*t0)
- At time t0+2 we have e^(-0.5*(t0+2))
- The proportional decrease found is: e^(-0.5*(t0+2)) / e^(-0.5*t0)
= 0.36788 to 6 s.f.
This confirms our result from above and we have established that the oscillations will decrease by a factor of 0.36788 in any 2 second interval.
plotXpose app is available on Google Play and App Store
Google Play and the Google Play logo are trademarks of Google LLC.
A version will shortly be available for Windows.
A version will shortly be available for Windows.
plotXpose app is a companion to the book Mathematics for Electrical Engineering and Computing by Mary Attenborough, published by Newnes, 2003.


