Identifying the inverse - Solution
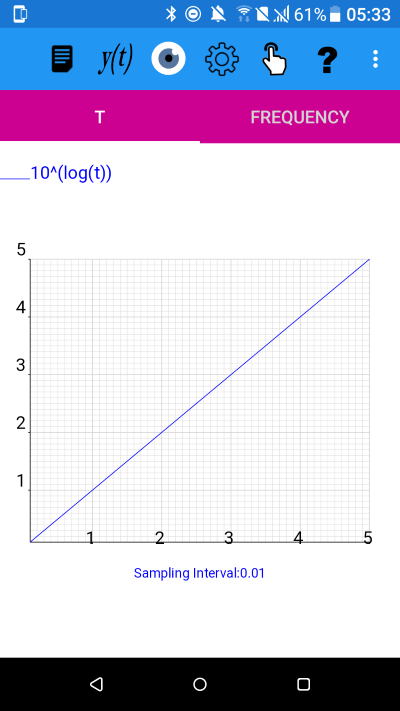
y(t)=10^(log(t)), for 0.1<=t<5.01
y(t)=sin(arcsin(t)) for -1<=t<1.01
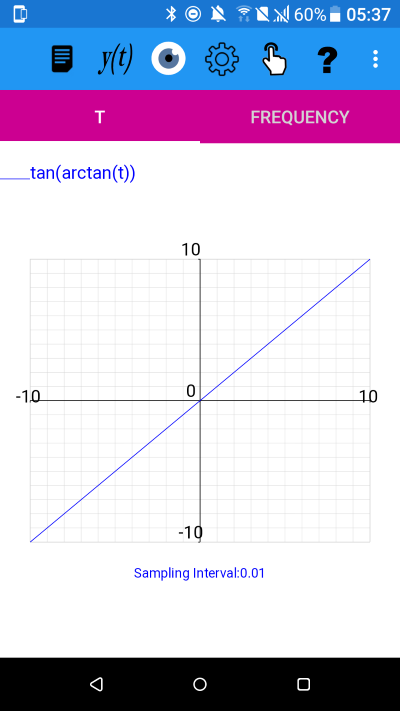
y(t)=tan(arctan(t)) for -10<=t<10.01
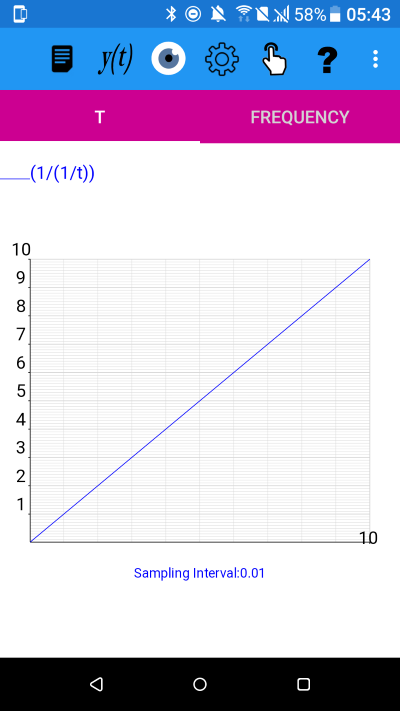
y(t)=(1/(1/t)) for 0.1<=t<10.01
What do all the above graphs have in common and why?
All the above are graphs of y=t i.e. the identity function.
This is because, in each case, we are taking the composition of a function with its own inverse.
This is because, in each case, we are taking the composition of a function with its own inverse.
The inverse of a function f is a function that undoes the operation of f. The inverse function is represented by f-1.
So the composition ff-1(t)=t is the mapping of t to t.
y=t is called the identity function because it leaves any input value unchanged.
plotXpose app is available on Google Play and App Store
Google Play and the Google Play logo are trademarks of Google LLC.
A version will shortly be available for Windows.
A version will shortly be available for Windows.
plotXpose app is a companion to the book Mathematics for Electrical Engineering and Computing by Mary Attenborough, published by Newnes, 2003.


